Tableau
Para la versión en español, de click aquí.
This is a mock-up where, while working with a stakeholder who would like to start an Airbnb business in Mexico City, we created the following information in Tableau, taking data from http://insideairbnb.com/mexico-city. Our stakeholder is interested in knowing where the best place to add their new Airbnb property would be. There are a few factors that they need to consider in order to make a decision, we created the following graphs and dashboard to help the stakeholder with their decision.
Data was taken from http://insideairbnb.com/mexico-city
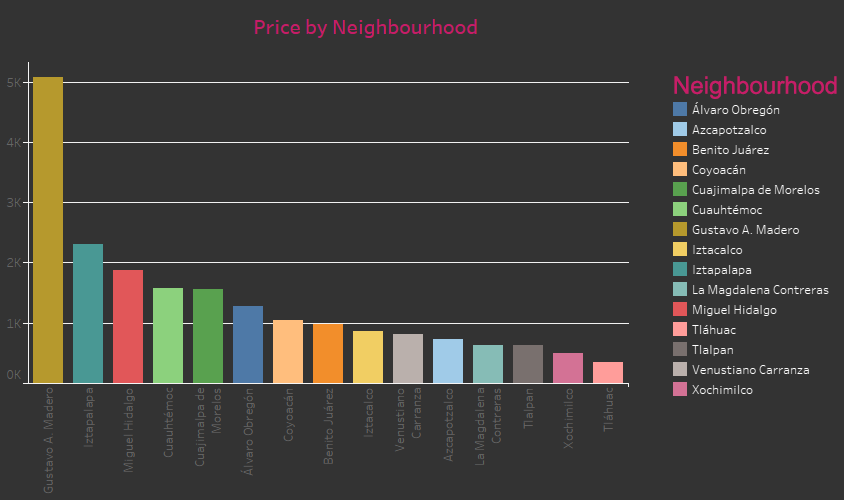
Initially, we wanted to conduct a comprehensive review of the best neighbourhoods in Mexico City to list our Airbnb in.
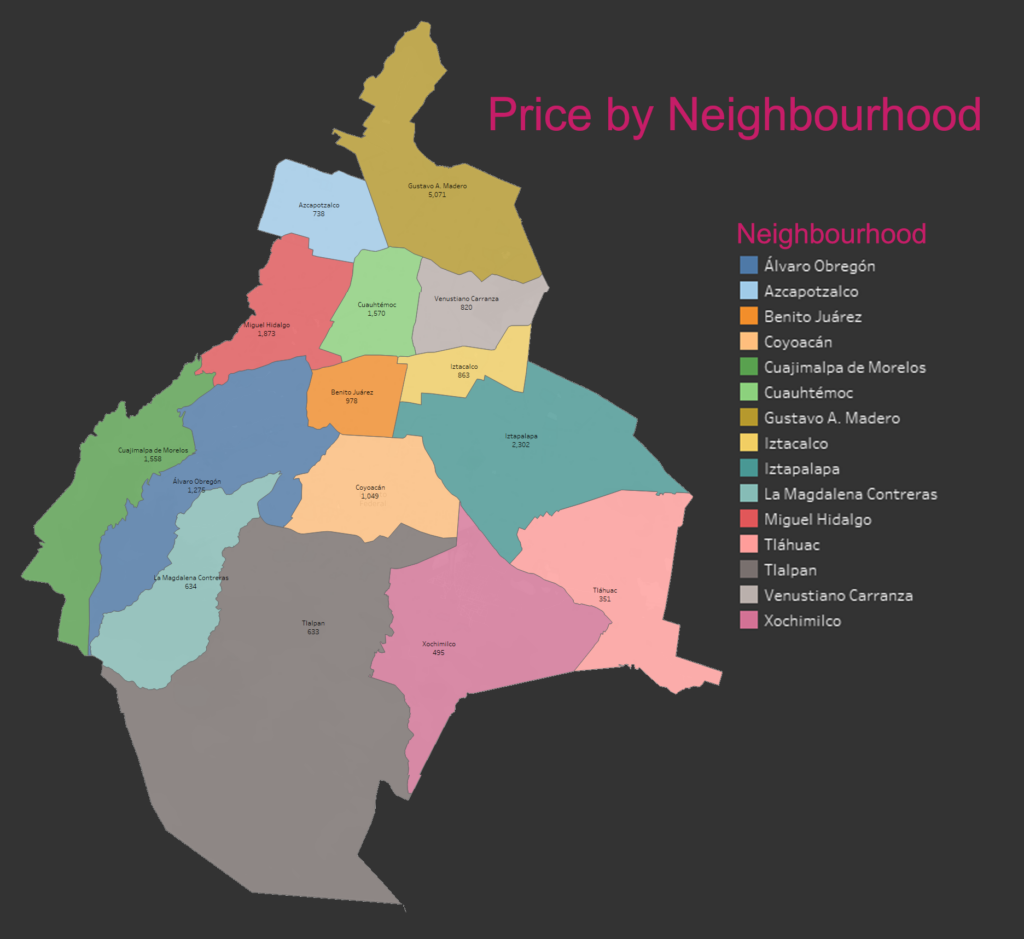
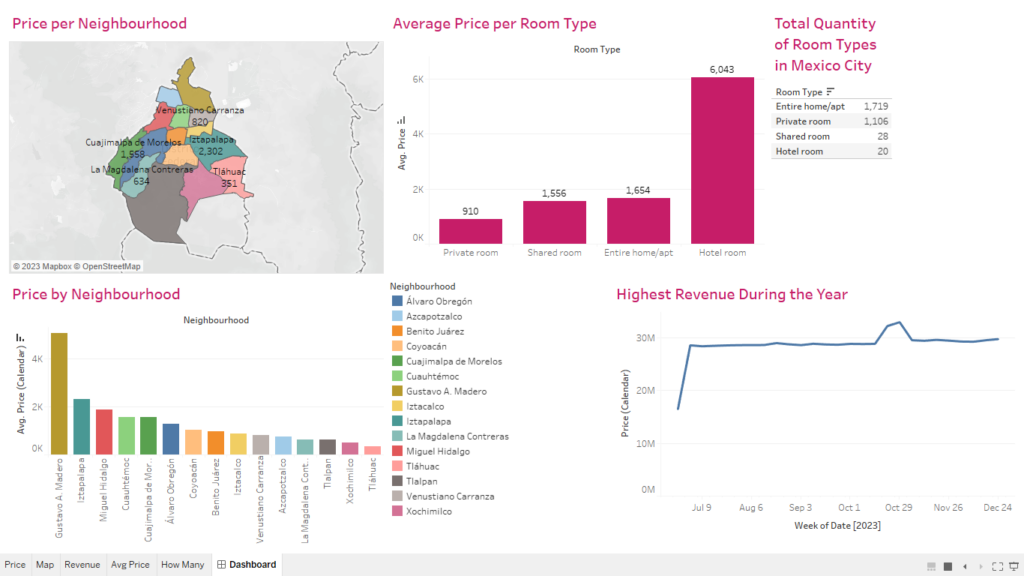
To make this graph more visually appealing and to give a better understanding of the data, we created a map of Mexico City with the different neighbourhoods color-coded according to their average Airbnb price. We also included the price under the neighbourhood name labels on the map for easy reference.
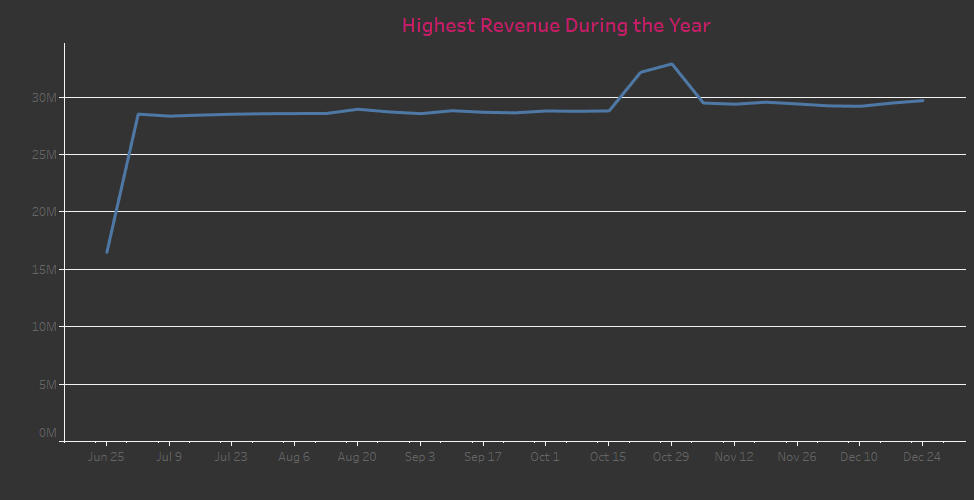
After reviewing the different locations and prices, the stakeholder wanted to know when the highest revenue of the year occurred. To answer this question, we created the following graph, which shows the weekly revenue of Airbnb rentals in Mexico City from June to December.
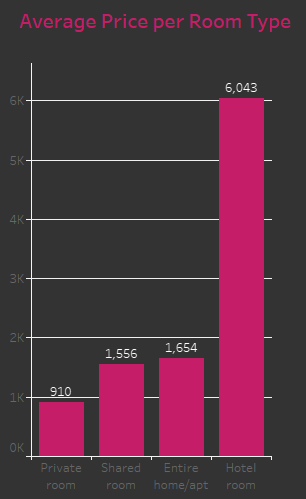
The stakeholder wanted to know the average price per type of room, including private and shared rooms, entire homes and apartments, and hotel rooms. To answer this question, we created a table that showed the average price for each type of room.
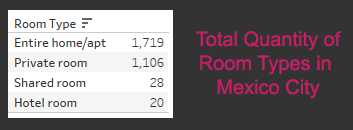
Finally, our stakeholder wanted to know how many listings of each room type (private room, shared room, entire home or apartment, hotel room) were available in Mexico City. To answer this question, we conducted a search on Airbnb and collected data on the number of listings for each type of room.
Our stakeholder will still have some questions and will probably want to modify and work with the data to find the answer to those questions. This is just the beginning of exploring the information. As we answer more questions, we can add them to the dashboard, which can be found here.
Data was taken from http://insideairbnb.com
More information as well as updates on http://insideairbnb.com/mexico-city
To view the dashboard and poke around, you can go to the public Tableau link: https://public.tableau.com/app/profile/brenda.cantu2746/viz/AirBnBProjectCDMX/Dashboard
