Marketing Analytics
Para la versión en español, de click aquí.
Marketing analytics is the practice of using data to evaluate the effectiveness of marketing activities. By collecting, analyzing, and interpreting data, marketers can gain insights into customer behavior, identify trends, and optimize their marketing campaigns. This can lead to improved ROI, increased brand awareness, and higher customer satisfaction.
During this part of the Grow With Google Digital Marketing and E-Commerce Certificate, I will be creating several of the elements that compose marketing analytics as part of my coursework.
Performance Goals
In this exercise, the company’s goals are to increase annual sales by 10% over the previous year, as well as to sell new products on the company’s website. Running email and social media campaigns is necessary to increase website traffic and conversions, as measured by click-through rate (CTR) and conversion rate (CVR). This is the documentation needed to understand what the performance goals will be.
Business Goal:
- Increase annual revenue by 10% over 2020 by the end of Q4.
Marketing Goals for Q4:
- Increase the combined CVR from all marketing channels by 2% (two percentage points) above the CVR in Q3.
- Increase the combined CTR from all marketing channels by 5% (five percentage points) above the CTR in Q3.
| Media Channel | KPIs | Industry Benchmarks | Q3 Performance | Q4 Performance Goals |
|---|---|---|---|---|
| CVR | 8.3% | 7.5% | Increase the conversion rate to 8.7% | |
| CTR | 2% | 1.5% | Increase the click-through rate to 2.3% | |
| Social Media | CVR | 4% | 3.33% | Increase the conversion rate to 4.1% |
| CTR | 1.1% | 1% | Increase the click-through rate to 1.6% |
Google Analytics
For this section I used the Google Merchandise Store demo account, which is a Google Analytics 4 account, to look at acquisition, engagement, and monetization metrics. You can access the demo account and play with it yourself by clicking here.
Acquisition metrics:
| Search Engine | Total new users 59,163 | Number of new users per search engine | Percent of new users: Number of new users / Total new users x 100 |
|---|---|---|---|
| 25,736 | 43% | ||
| Bing | 148 | 0.25% | |
| Yahoo | 283 | 0.47% | |
| Baidu | 1,855 | 3.13% |
In researching further, we can notice that Bing had the highest average engagement time among search engines at 1 minute and 31 seconds. Baidu had the highest engagement rate at 86.94%.
Google Analytics collects the metrics for Baidu searches from mobile users. There were 117 new users from the mobile source, m.baidu.com.
Engagement Metrics
For this part of the exercise, I have to look at the following metrics:
- sessions_start
- add_to_cart
- begin_checkout
- remove_from_cart
- purchase
I will also calculate the number of users with cart abandonment and the percentage of users with cart reduction.
| Event | Total users |
|---|---|
| sessions_start | 92,395 |
| add_to_cart | 19,774 |
| begin_checkout | 4,882 |
| remove_from_cart | 1,482 |
| purchase | 1,421 |
Number of users with cart abandonment: 4,882 – 1421 = 3,461
Sales conversion rate: (1,421 / 92,395) x 100 = 1.54%
Monetization Metrics
For this portion of the project, I will include total revenue, the number of first-time buyers, and the three top-selling products:
| Total Revenue | Number of First Time Purchases | #1 Item Sold | #2 Item Sold | #3 Item Sold |
|---|---|---|---|---|
| 143,000 | 1,100 | Google Ombre Lime Pen | Google Inspired Green Notebook | Google Pen Red |
ROI calculations for campaign debriefing
In this part of the project, I will estimate the ROI by calculating the ROAS and the LTV. To look at the data, you can click here.
ROAS
| Expression | Campaign ROAS | ROAS for search ads | ROAS for display ads | ROAS for social ad | ROAS for shopping ads |
|---|---|---|---|---|---|
| Number | 2.01 | 1.71 | 1.76 | 4.67 | 3.55 |
| Percentage | 201% | 171% | 176% | 467% | 355% |
| Ratio | 2:01:1 | 1.71:1 | 1.76:1 | 4.67:1 | 3.55:1 |
AOV
| Campaign AOV | AOV for search ads | AOV for display ads | AOV for social ads | AOV for shopping ads |
|---|---|---|---|---|
| $80.55 | $128.69 | $27.61 | $87.41 | $61.00 |
LTV
| Campaign LTV | LTV for search ad | LTV for display ads | LTV for social ads | LTV for shopping ads |
|---|---|---|---|---|
| $128.88 | $193.04 | $55.22 | $131.12 | $91.50 |
LTV to CAC ratios
| Campaign LTV:CAC | Search ads LTV:CAC | Display ads LTV:CAC | Social ads LTV:CAC | Shopping ads LTV:CAC |
|---|---|---|---|---|
| 1.98 | 1.72 | 1.78 | 4.68 | 3.66 |
Percentages of new customers making purchases
| Campaign percentage | Search ads percentage | Display ads percentage | Social ads percentage | Shopping ads percentage |
|---|---|---|---|---|
| 18.37% | 19.75% | 17.53% | 13.51% | 23.16% |
(Number of unique new account purchasers / Number of new accounts) x 100
Future Budget Decisions
Based on the ROAS calculations, we should move some of the budget from search ads to social or shopping ads, as they have a higher ROAS of 467% and 355%, respectively. In contrast, search ads have a ROAS of 171%.
If there is only enough budget to create a custom landing page for one channel, prioritize social ads. Here is the decision process:
- We only need to consider search, social, and shopping ads since display ads already have the highest purchase frequency of 2.
- We narrowed it down to search and social ads since the percentage of new customers who made purchases from shopping ads (23.16%) is higher than the percentages for search (19.75%) and social (13.51%).
- We chose social ads because the percentage of new customers who made purchases from social ads (13.51%) is lower than the percentage for search ads (19.75%).
A/B Testing Plan
An A/B test is a two-group online experimentation method that randomly assigns 50% of users to each group to see which one performs better. To design an A/B test, it is important to have a plan that specifies the key details, such as the descriptions of the variants, their current and expected performance, and the essential metrics that will be used to measure the success of the test. To create this test, we will be using the same metrics found here.
A/B Testing Plan:
Updated headline for Google Ads campaign | Author: Digital marketer | Last Updated: July 6
Test details
| Test ID: | 7815 |
| Overview: | Stay Hotel is running an A/B test to see if a deals-focused headline will improve their Google Ads results. |
| Asset type: | Direct response ad |
| Channel: | Google Ads |
| Duration: | 30 days |
| Test launch date: | July 17 |
| Users per variant: | 3,000 |
| Primary metric: | Conversion rate |
| Current conversion rate: | 2% |
| Expected conversion rate: | 7% (a five percentage point increase) |
| Confidence level: | +95% (Minimum 95%) |
| Hypothesis: | We expect that using a deals-focused headline will increase our conversion rate to 7%, as our target audience is made up of deal seekers. |
Variants
Data Visualizations
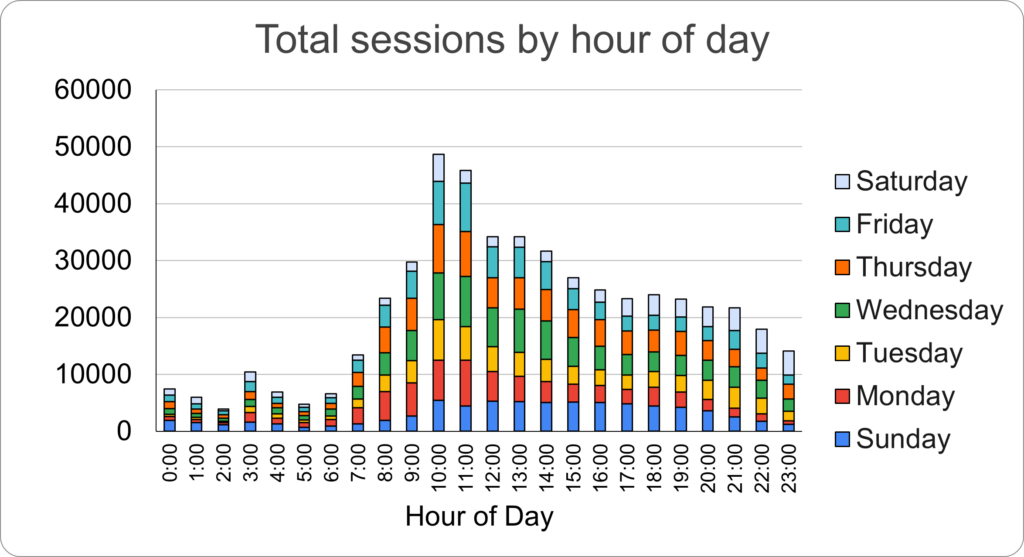
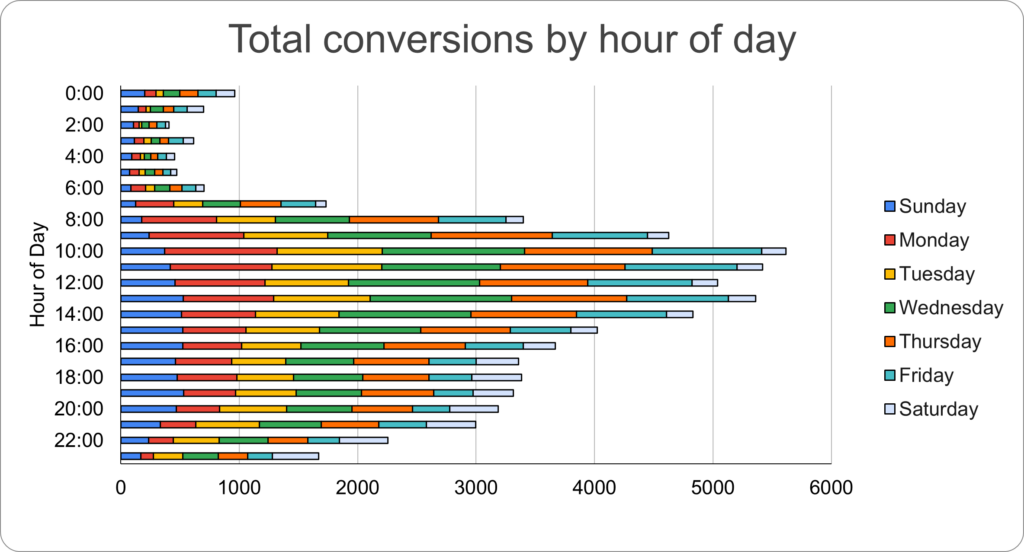
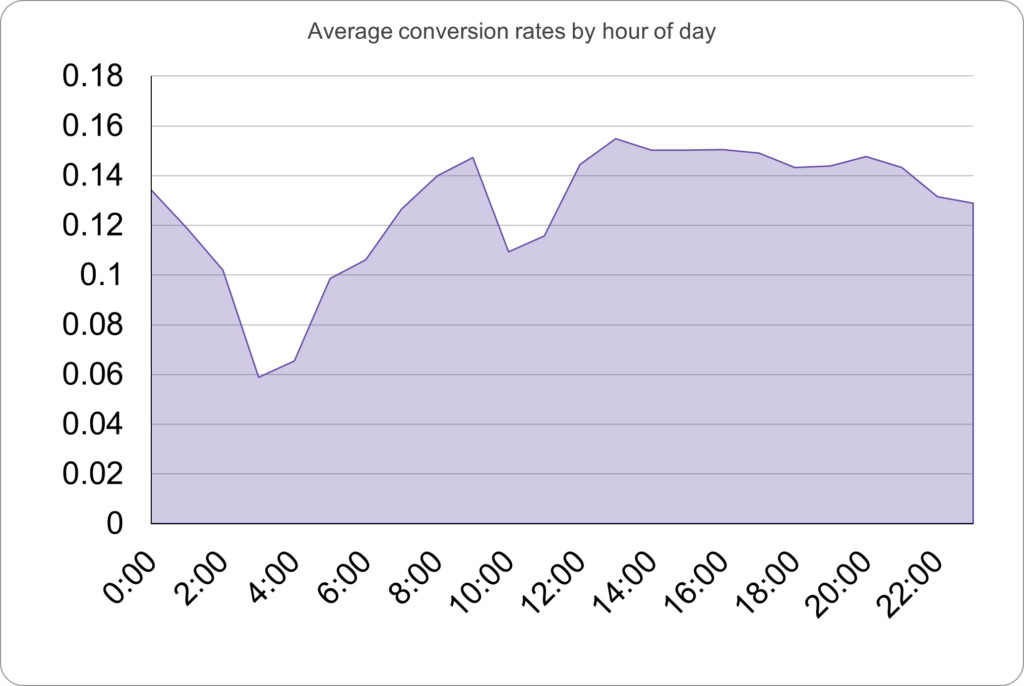
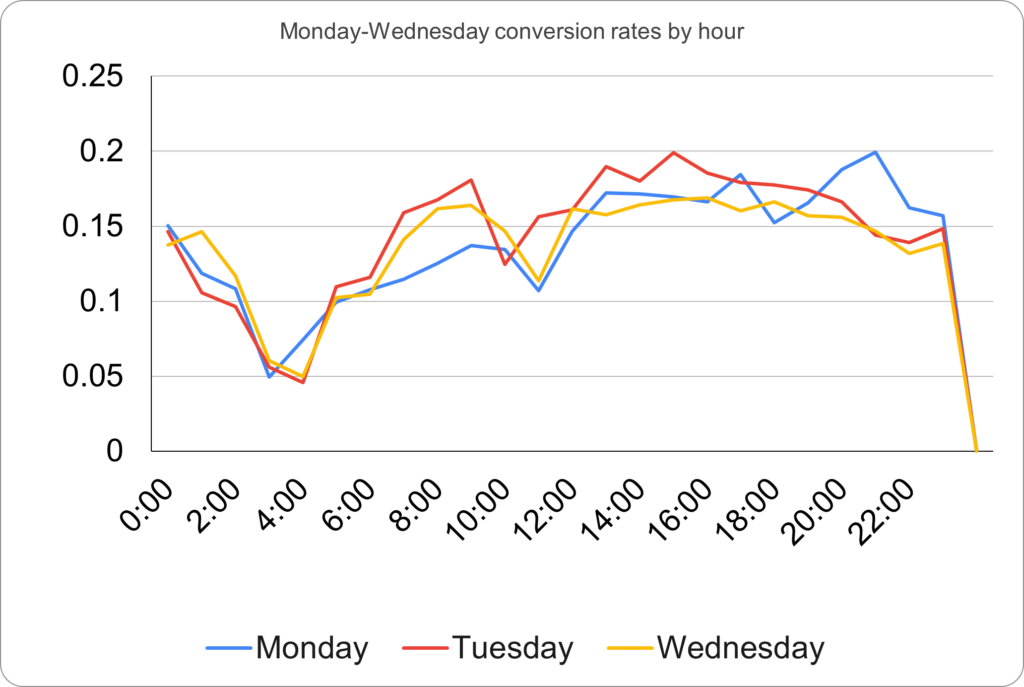
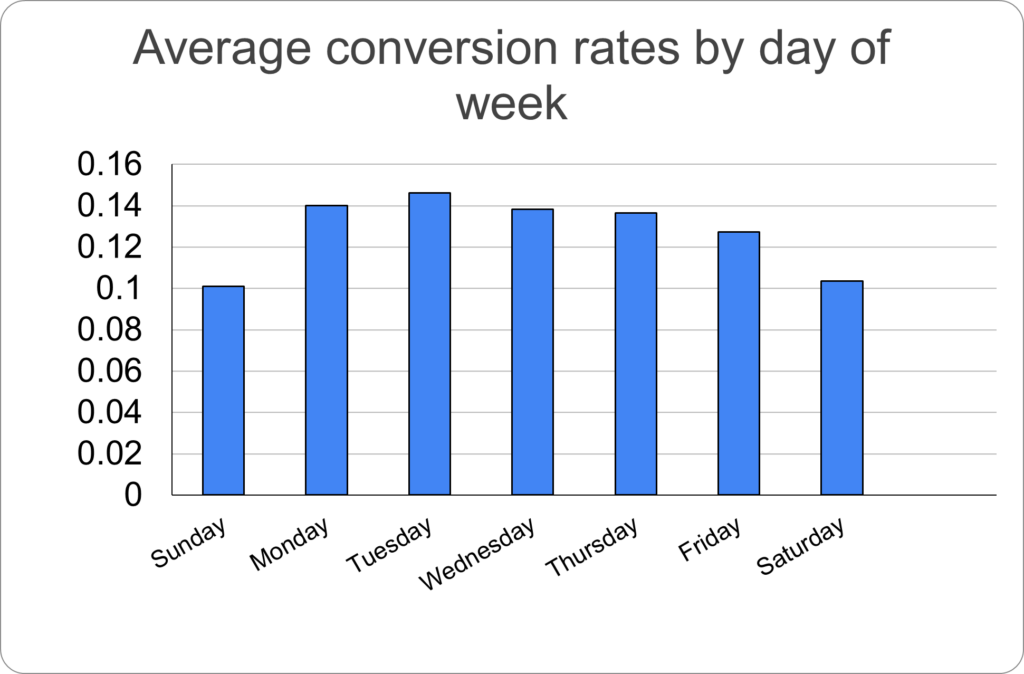
We have made suggestions on how to adjust the campaign strategy before presenting the information to L’Acier. It is important to create graphics to help stakeholders understand the information. Here are the visualizations created for the presentation that will be shown to L’Acier:
Presenting the Data
After analyzing the campaign strategy and making suggestions for adjustments, we created visualizations for the presentation. We will now present the data and recommendations to the digital marketing leaders. There will also be C-level stakeholders in this meeting, so we will have limited time to present the information. A general summary that addresses their interests and concerns will be sufficient.
The two main questions that need to be answered are:
- What changes do you recommend making and why?
- How will your recommendations benefit our department or company?
This is the presentation that explains the adjustments, data, and recommendations that will be discussed in the meeting.
Marketing analytics is a complex and ever-evolving field. However, by understanding the basics and using the right tools, you can gain valuable insights that can help you improve your marketing campaigns and achieve your business goals.


